Jethro Ku Man Chun 3036188377
Topic:
Is Media Hype a Contrarian Indicator? An Analysis of NYT Coverage and Nvidia (NVDA) Stock Performance
As a retail investor, I have heard a hypothesis several times. Financial markets frequently operate on information asymmetry. When institutional investors prepare to secure profits at market peaks, they require significant retail buying pressure to provide exit liquidity. Intensive media coverage naturally captures public attention, often sparking retail exuberance that inadvertently creates the perfect distribution window for the “smart money.”
To empirically test this contrarian hypothesis, I analyzed the relationship between media hype and stock performance over 21 weeks. Using Python in Google Colab, I queried the New York Times (NYT) Article Search API for the keyword “Nvidia” to gauge weekly media volume, while concurrently utilizing the Yahoo Finance library to retrieve NVDA’s weekly market data. During the data cleaning process using Pandas, I specifically shifted and aligned the news publication timeframe (Week $X$) with the subsequent week’s stock return (Week $X+1$) to evaluate predictive validity.
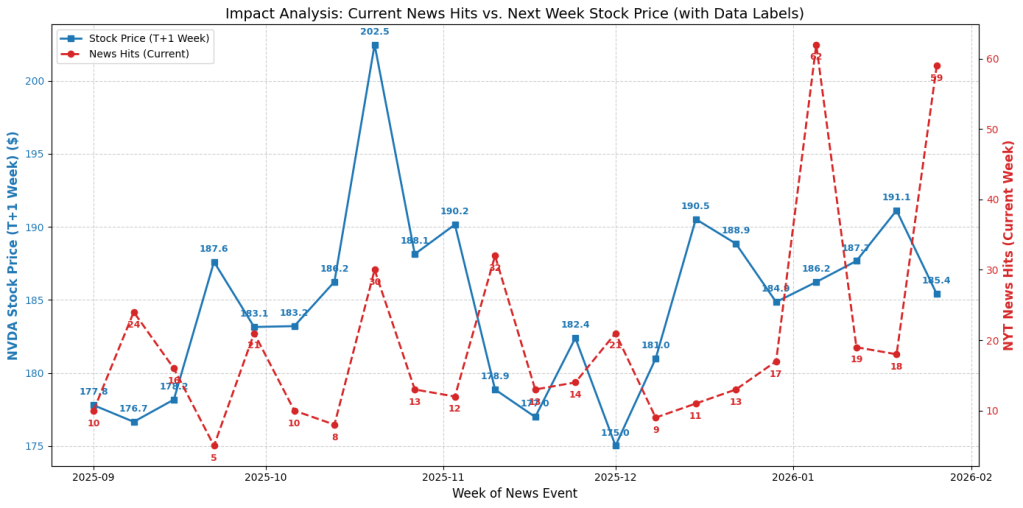
Comparing the stock price and news hits, we can not see a clear correlation.
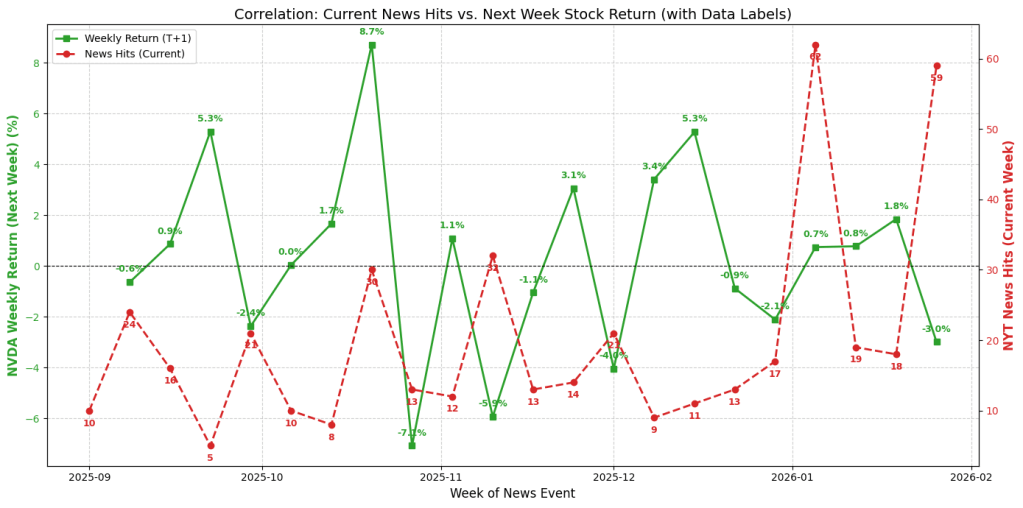
By changing the stock price into the weekly returns of the stock, and comparing them with news hits. We still cannot see a clear correlation between them.
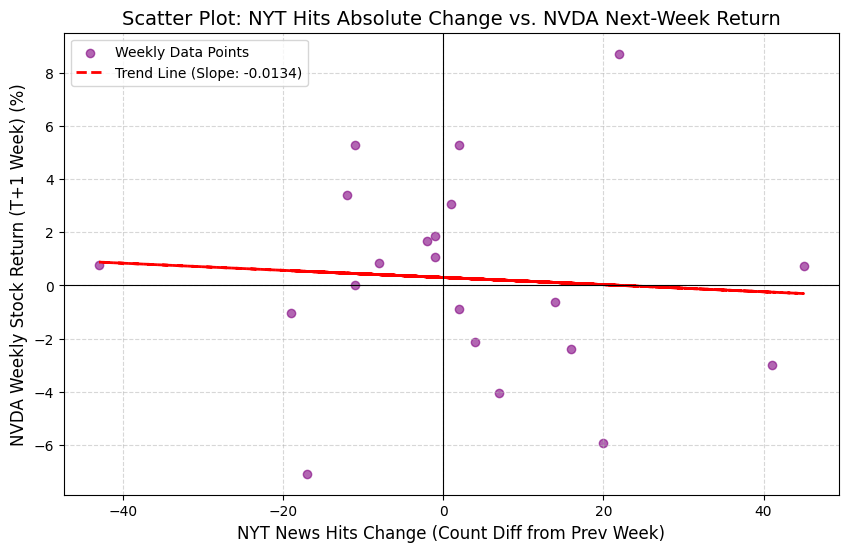
Initial scatter plot analysis revealed negligible linear correlation between the absolute change in news volume and subsequent stock returns (R^2 = 0.0051).

However, shifting the analytical focus to directional movement uncovered a striking phenomenon: there is a 71.43% probability of an inverse relationship between NYT news volume changes and the following week’s stock trajectory.
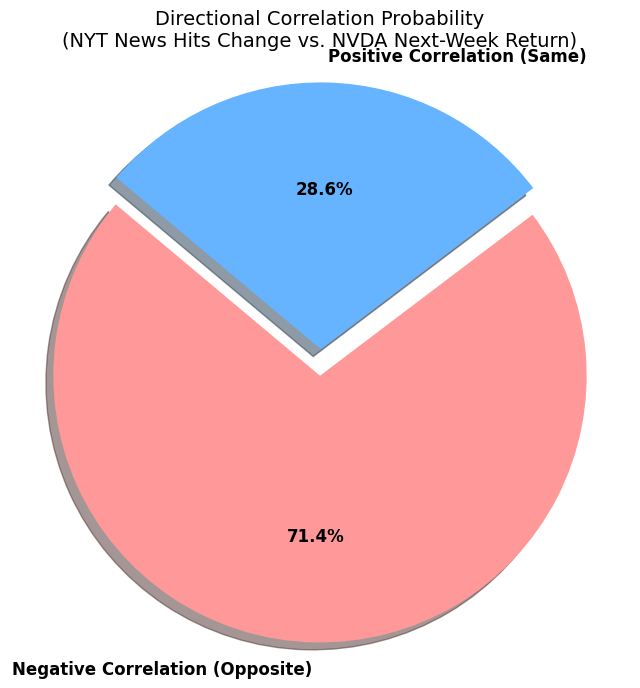
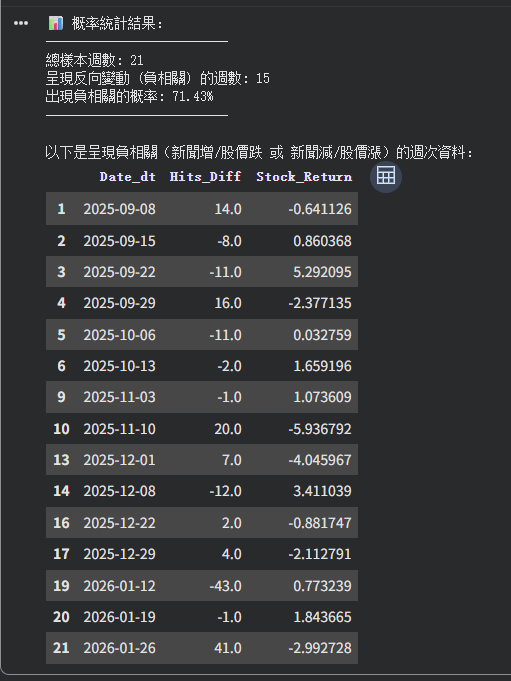
This statistical divergence suggests that spikes in media coverage often mark short-term market tops.
However, there are several improvements that can be made to help the study to become more comprehensive and convincing. For instance, the methodology relied on raw keyword counts without deploying Natural Language Processing (NLP) for sentiment analysis, which constrains the credibility of study results. During the week of November 10, 2025, the NYT’s mentions of Nvidia surged significantly (an increase of 20 hits), yet the stock subsequently declined by nearly 6%.
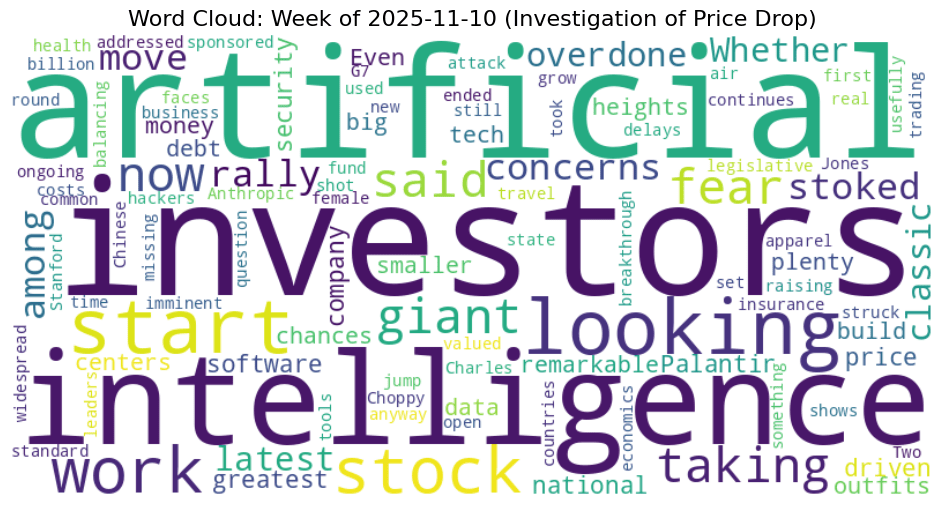
As illustrated in the word cloud generated from the week (November 10, 2025), the coverage was not purely positive. It included cautionary terms like “fear,” “concerns,” “overdone,” and “delays.” Cautionary reports will not attract retail investors to buy the stock. Thus, even though the stock price has declined following the increase in media exposure, this case is inconsistent with our hypothesis.
Also, the sample size of this study was restricted, limiting the validity of the results. A 21-week sample size captures only a fraction of a broader market cycle. Observing more individual stocks also helps verify whether this hypothesis holds widely in the U.S. stock market.
Finally, collecting data in daily basis instead of a weekly basis may also help to improve the accuracy. For large-cap stocks with a high level of information transparency, like Nvidia, the market usually completes pricing within minutes after a news release. By “next week,” the impact of the news may have already been overshadowed by other new macro events (such as Federal Reserve interest rate decisions).
Link of colab: https://colab.research.google.com/drive/1CyE6qdG6ngVwh00S287tu4jJHHlKvyni?usp=sharing
