Name: Jethro Ku Man Chun (3036188377)
The Sentiment Signal: Does Media Emotion Predict NVDA Stock Reversals?
In my previous analysis, I suggested a 71.4% probability that spikes in raw media volume act as a contrarian indicator for Nvidia (NVDA). However, raw keyword counting without sentiment analysis restricts the credibility of my result. To deepen this investigation, this study shifts focus from volume to sentiment polarity to test if mainstream optimism truly creates distribution windows for institutional investors.
Methodology & Data Processing
I queried the New York Times (NYT) Article Search API to extract 22 weeks of NVDA article abstracts and utilized the yfinance library for weekly market data. Using Python and Pandas in Google Colab, I cleaned the dataset, dropped missing values, and aligned the publication week (Week T) with the subsequent week’s stock return (Week T+1).
To address the limitations of raw hit counts, I applied Natural Language Processing (NLP). Specifically, I deployed NLTK’s VADER—an unsupervised lexicon-based model—to parse the concatenated weekly abstracts and generate a continuous composite Sentiment Score (-1.0 to 1.0) for each week.
Findings & Interpretation
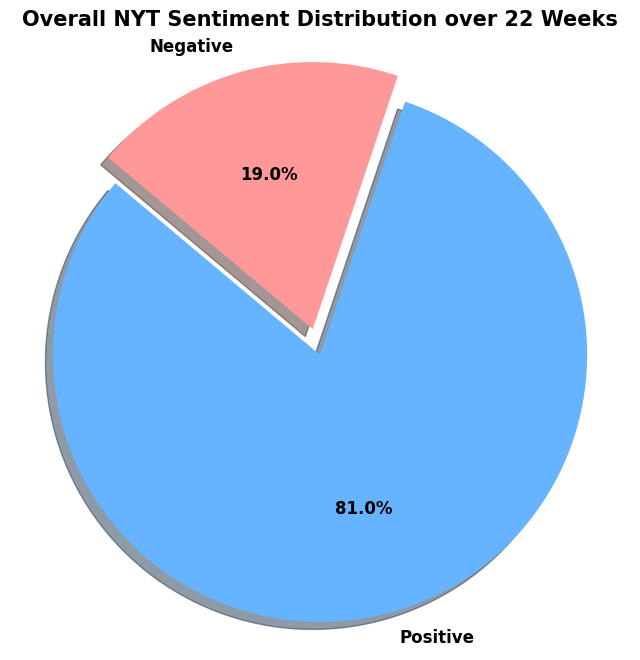
The VADER analysis revealed that NYT coverage was very optimistic, with 81.0% of the weeks receiving a positive score (above 0). This persistent positivity indicates that NVDA’s strong fundamentals were heavily highlighted in mainstream reporting.
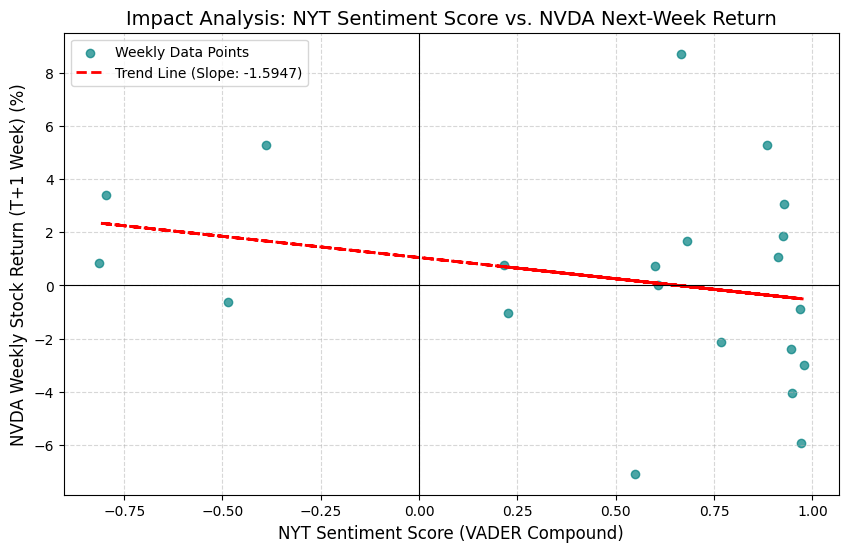
Comparing these sentiment scores against next week’s stock returns yielded, we can observe a weak negative linear correlation (R-square = 0.0594). The scattered distribution implies that media sentiment alone is an insufficient predictor of exact weekly price changes. Macro factors—such as shifting Federal Reserve interest rate expectations—likely overshadowed media-driven retail flows during this period.
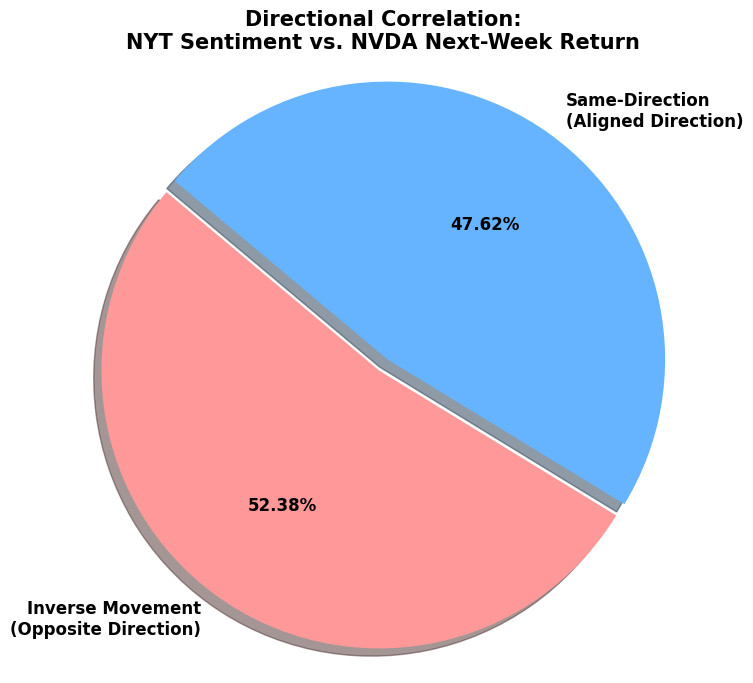
Despite the low R-square, the directional analysis provided critical insights. The data showed an inverse movement (e.g., positive sentiment followed by a negative return or negative sentiment followed by a positive return) in 52.38% of the observed weeks.
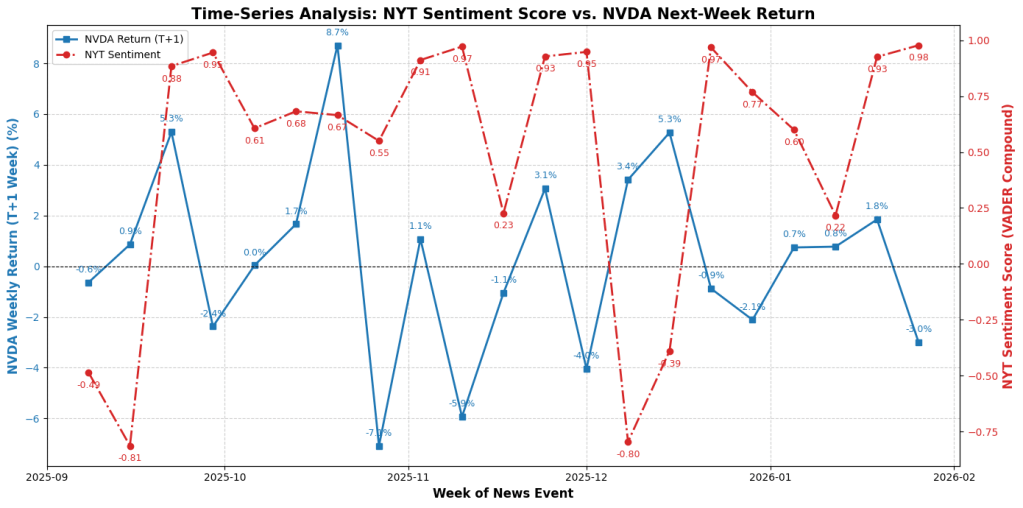
While this 52.38% probability is lower than the previous volume-based findings, the time-series visualization highlights acute divergences. During periods of peak media optimism—such as late October and November 2025, where sentiment scores sustained above 0.95—NVDA subsequently suffered severe drawdowns of -5.9% and -7.0%.
Machine Learning-based VS LLM-Based Sentiment Analysis
I also used Llama 3.1 8B to do sentiment analysis and compare the result with VADER. Observed obvious differences:
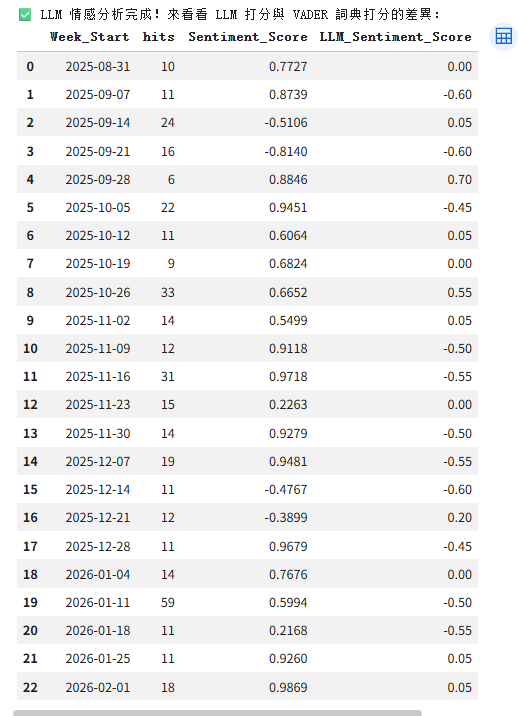
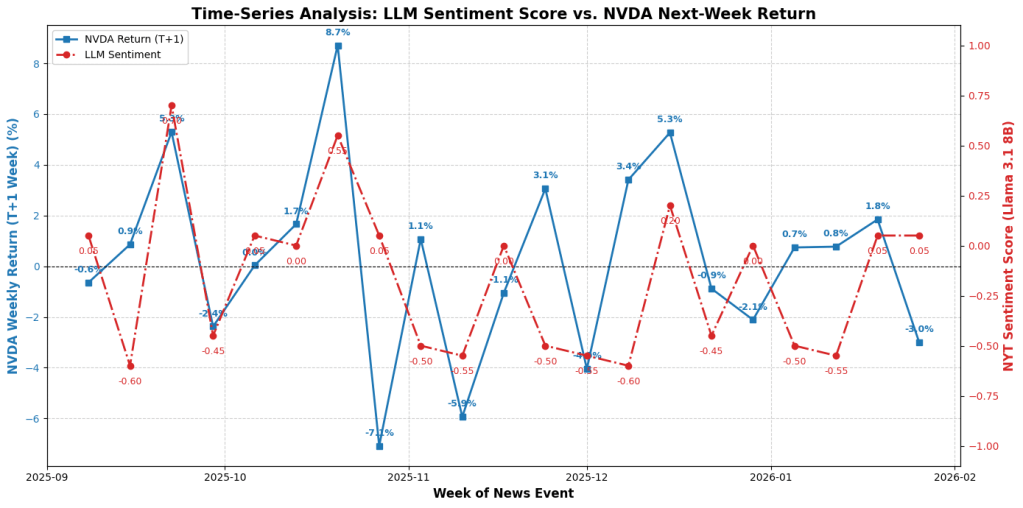
Llama 3.1 8B yields less extreme sentiment scores, with some scores of 0 indicating “neutral”. Looking at the dual-axis line chart, comparing the sentiment score from LLM and return of NVDA (T+1), it may seem like the stock price moves following the sentiment score from LLM.
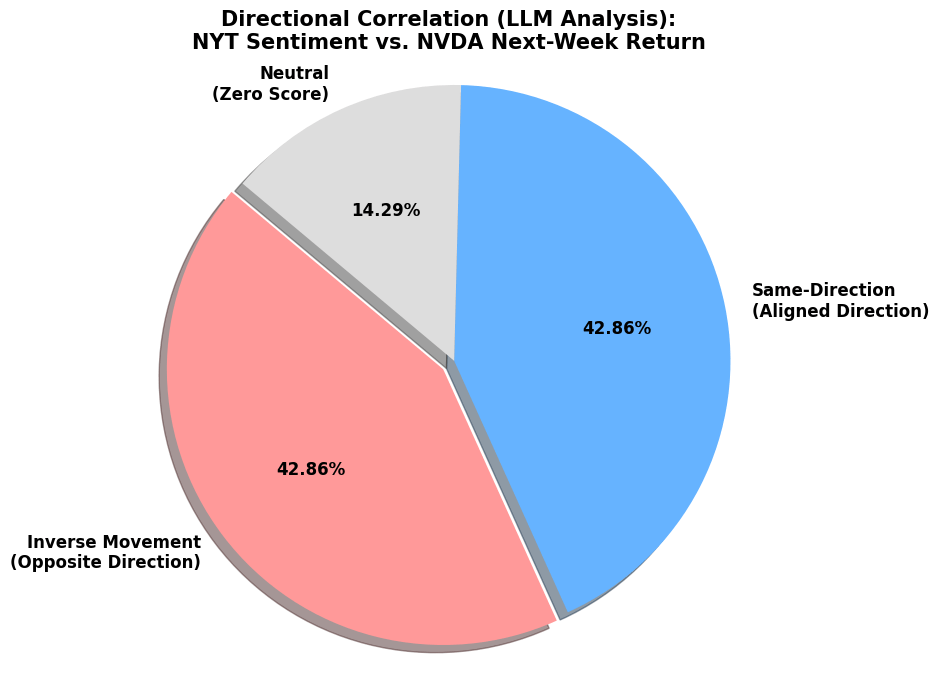
However, if we calculate the direction correlation of each pair of sentiment scores and stock returns. We will see that there is no preference for the same or inverse directions of movements.
To conclude, sentiment analysis of NYT from VADER or Llama 3.1 8B is generally unreliable in predicting the stock return of NVDA next week. However, extreme consensus in mainstream media sentiment may be able to act as a contrarian indicator, signaling imminent market reversals.
Colab Link: https://colab.research.google.com/drive/1oOOHlbOOIgoF1ngThontR961Aby6Rjp7?usp=sharing
