Topic:
Wealth and Academic Hegemony: A Data-Driven Analysis of Global Top Universities (2021-2025)
Jethro Ku Man Chun 3036188377
As a student with dual backgrounds in Journalism and Finance, I have heard a hypothesis several times: building world-class research institutions is fundamentally a capital-intensive game. While small nations can excel in niche fields, dominating global academic rankings requires massive, sustained national wealth.
To empirically test this hypothesis, I analyzed the relationship between a country’s macroeconomic wealth (Total GDP) and its academic supremacy over a 5-year period (2021-2025). Using Python in Google Colab, I deployed a dynamic web scraping script utilizing google-colab-selenium and the BeautifulSoup library to extract Shanghai Ranking (ARWU) data across multiple paginations. During the data cleaning process using Pandas, I parsed hidden HTML tags to extract country names, aggregated the top 150 university counts, and merged this dataset with the 2024 IMF macroeconomic GDP data for seven core economies (US, China, UK, Japan, Australia, India, and Switzerland).
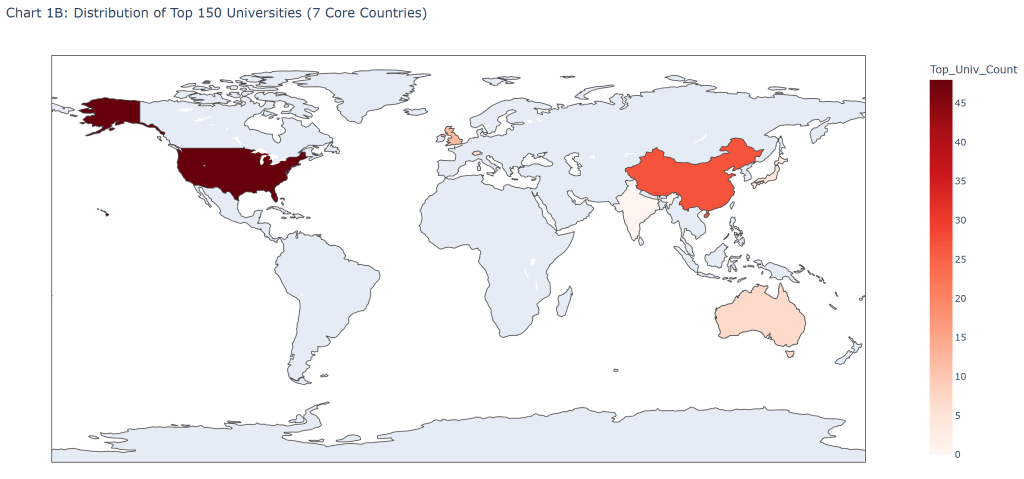
Comparing the world wealth distribution and the global top university distribution via heatmaps, we can see a striking geographical overlap.
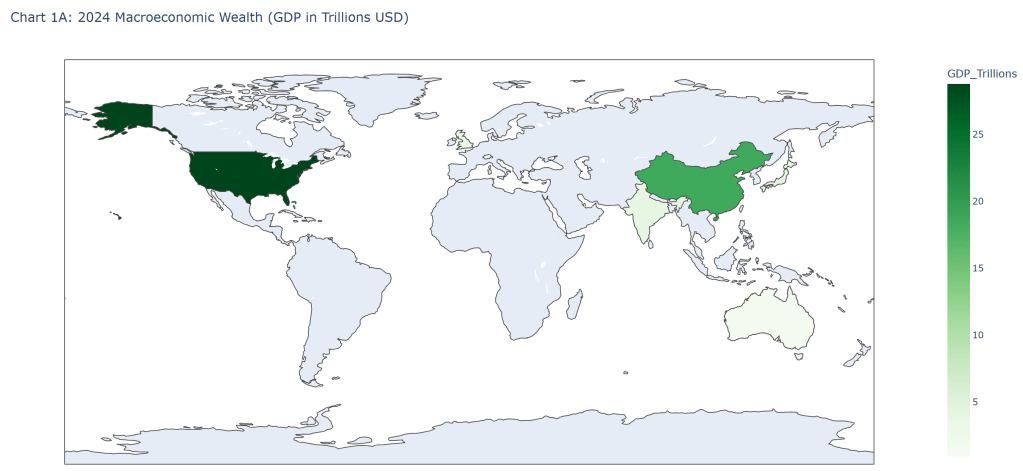
(Click the images to access interactive charts)
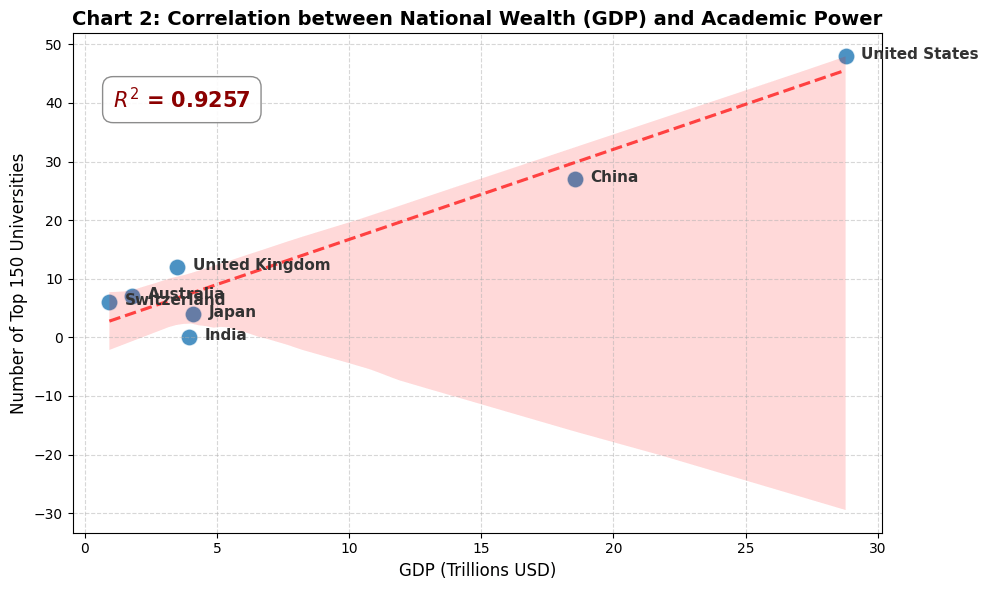
Initial scatter plot analysis [Chart 2] revealed an exceptionally strong positive linear correlation between a nation’s total GDP and its number of top 150 universities (R^2 = 0.9257). This statistical evidence suggests that over 92% of the variance in academic dominance can be explained solely by a country’s GDP volume, effectively proving that elite education requires massive capital backing.
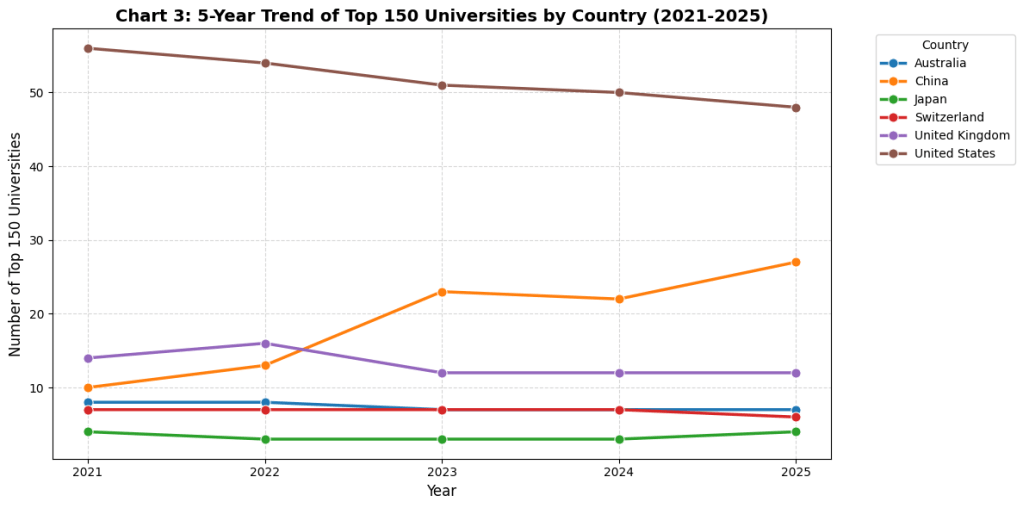
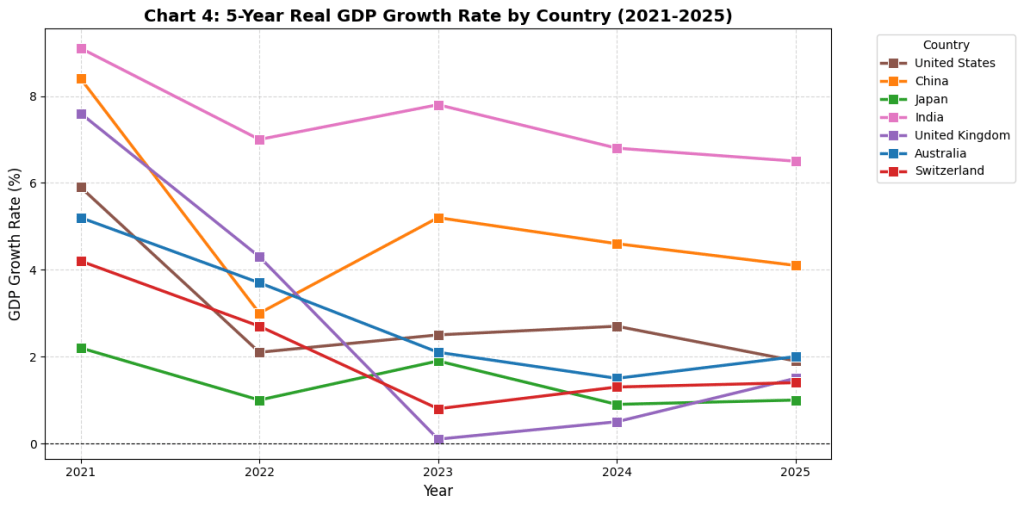
However, shifting the analytical focus to time-series trends [Chart 3] and comparing it with real GDP growth rates [Chart 4] uncovered another striking phenomenon. The trajectory of top universities is highly rigid and insulated from short-term economic shocks. For instance, while an emerging economy like India boasts the highest GDP growth rate, its representation in the top 150 remains completely stagnant at zero. Conversely, despite China’s recent economic deceleration, its academic influence surged aggressively from 10 top universities in 2021 to 27 in 2025. This statistical divergence suggests that academic hegemony relies on decades of accumulated total wealth (a “stock” metric) rather than temporary economic booms (a “flow” metric).
However, there are several improvements that can be made to help the study become more comprehensive and convincing. For instance, relying on Total GDP inherently favors massive economies like the US and China. Observing smaller, highly developed economies like Switzerland and Australia reveals a significant outlier effect: they possess moderate Total GDP but exceptional academic output.
Also, the sample size of this study was restricted to seven core countries, limiting the validity of the results. Observing more individual nations (for example, including more countries from Europe), would also help verify whether this hypothesis holds widely globally.
To conclude, while Total GDP is a strong predictor of absolute academic power, the current methodology restricts the credibility of explaining the success of smaller nations and the situation of India. Countries with smaller populations and higher economic development levels (UK and Japan) have more top 150 universities than India, while India has a similar amount of total GDP to these countries. Switzerland is also an extreme value, since it is able to achieve 6 Top 150 Universities with the smallest economic scale.
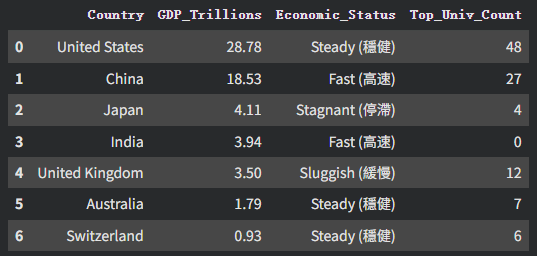
Total GDP (2024) and Top 150 University Counts(2025, ShanghaiRanking)
To deepen this investigation, future research should shift focus from Total GDP to “GDP per capita” and adjust the Y-axis to “Top Universities per 10 Million People.” This would better reveal how wealth concentration, rather than just economic volume, drives elite education.
Colab Link: https://colab.research.google.com/drive/1IoePiFPRKER-xeevqHXdw6u0XiN2LfnR?usp=sharing
